performance package
回帰分析のモデル評価を簡単にできるパッケージ(performance)の紹介。
このパッケージのいい点
1. glm, lmerやbrmsなどの一般化線形、階層、ベイジアンモデルに適用可能
2. R2とかRMSEとかVIFとか地味に必要なことがある指標がすぐ手に入る
3. 0過剰モデルとかでも適用可能
すごいね!まぁ最後のやつは自分の目で確かめてくれ!
サンプルデータ
使うのはbrmsに入っとるepilepsyデータ:
library(brms)## Warning: パッケージ 'brms' はバージョン 4.0.5 の R の下で造られましたlibrary(lme4)## Warning: パッケージ 'Matrix' はバージョン 4.0.5 の R の下で造られましたlibrary(performance)
data("epilepsy")
summary(epilepsy)## Age Base Trt patient visit
## Min. :18.00 Min. : 6.00 0:112 1 : 4 1:59
## 1st Qu.:23.00 1st Qu.: 12.00 1:124 2 : 4 2:59
## Median :28.00 Median : 22.00 3 : 4 3:59
## Mean :28.34 Mean : 31.22 4 : 4 4:59
## 3rd Qu.:32.00 3rd Qu.: 41.00 5 : 4
## Max. :42.00 Max. :151.00 6 : 4
## (Other):212
## count obs zAge zBase
## Min. : 0.000 1 : 1 Min. :-1.65125 Min. :-0.9444
## 1st Qu.: 2.750 2 : 1 1st Qu.:-0.85270 1st Qu.:-0.7197
## Median : 4.000 3 : 1 Median :-0.05414 Median :-0.3453
## Mean : 8.254 4 : 1 Mean : 0.00000 Mean : 0.0000
## 3rd Qu.: 9.000 5 : 1 3rd Qu.: 0.58471 3rd Qu.: 0.3662
## Max. :102.000 6 : 1 Max. : 2.18182 Max. : 4.4853
## (Other):230ポアソン回帰モデルの評価
回帰モデルを推定したObjectを用意して、model_performance()でモデルを評価しましょう:
fit1 <- glmer(count ~ zAge + zBase * Trt + (1|patient),
             data = epilepsy, family = poisson())

model_performance(fit1)
## # Indices of model performance
##
## AIC | AICc | BIC | R2 (cond.) | R2 (marg.) | ICC | RMSE | Sigma | Score_log | Score_spherical
## --------------------------------------------------------------------------------------------------------------
## 1357.583 | 1357.950 | 1378.366 | 0.819 | 0.532 | 0.612 | 4.957 | 1.000 | -2.501 | 0.055R2_conditionalはmixed modelの, R2_marginalは固定要因のみのモデル指標になります!
さらにcheck_collinearity()で多重共線性を評価しましょう:
check_collinearity(fit1)## # Check for Multicollinearity
##
## Low Correlation
##
## Term VIF VIF 95% CI Increased SE Tolerance Tolerance 95% CI
## zAge 1.10 [1.02, 1.44] 1.05 0.91 [0.69, 0.98]
## zBase 2.28 [1.91, 2.80] 1.51 0.44 [0.36, 0.52]
## Trt 1.02 [1.00, 35.80] 1.01 0.98 [0.03, 1.00]
## zBase:Trt 2.39 [1.99, 2.95] 1.55 0.42 [0.34, 0.50]# plot
x <- check_collinearity(fit1)
plot(x)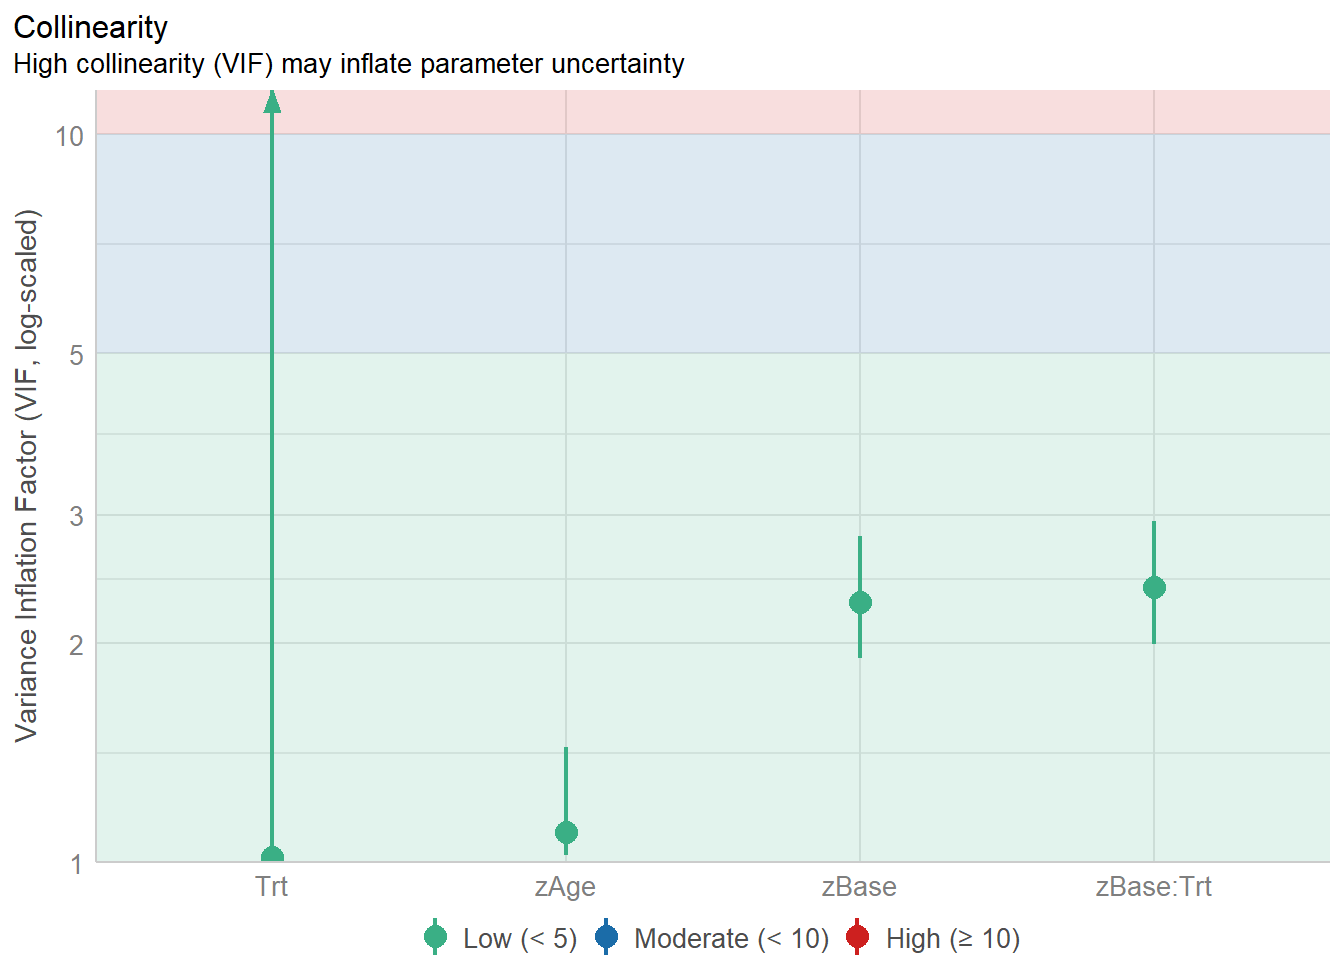
Bayesian用の使い方
BayesianはVIFとか見れないものもいくつかあります。
まぁ以下みたいなやつをみればよいでしょうよ(推定結果は面倒なので省略):
# 上述のモデルと全く一緒
fit1b <- brm(count ~ zAge + zBase * Trt + (1|patient),
            data = epilepsy, family = poisson())

# Bayesian用の指標が報告される(あたりまえ
model_performance(fit1b)
まぁ、基本こんなもんでしょう。
今日はここまで。ではまた。